Applications
Highest throughputs with lowest sample usage facilitate key insights throughout the development process
Biologics Developability
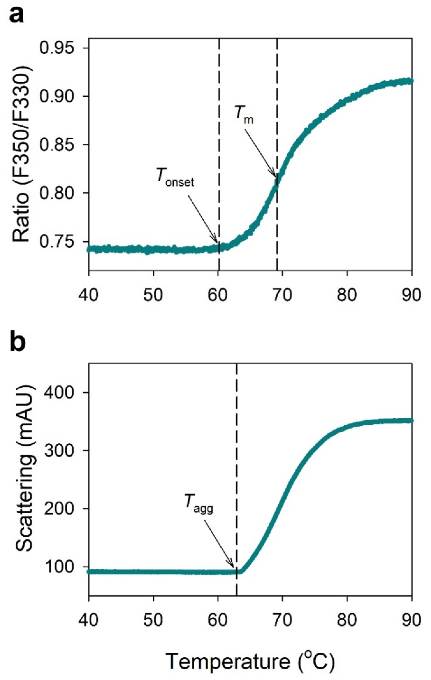
(a) Typical nanoDSF thermogram showing the fluorescence intensity ratio at 330 nm and 350 nm; (b) Light scattering thermogram by measuring the attenuation of the backreflected light intensity passing through the sample as a function of temperature. The sample was IgG at a concentration of 10 mg/mL in the 50 mM sodium phosphate buffer at pH 7.4. Tonset—onset temperature of thermal unfolding; Tm—inflection temperature of thermal unfolding; Tagg—onset temperature of protein aggregation.
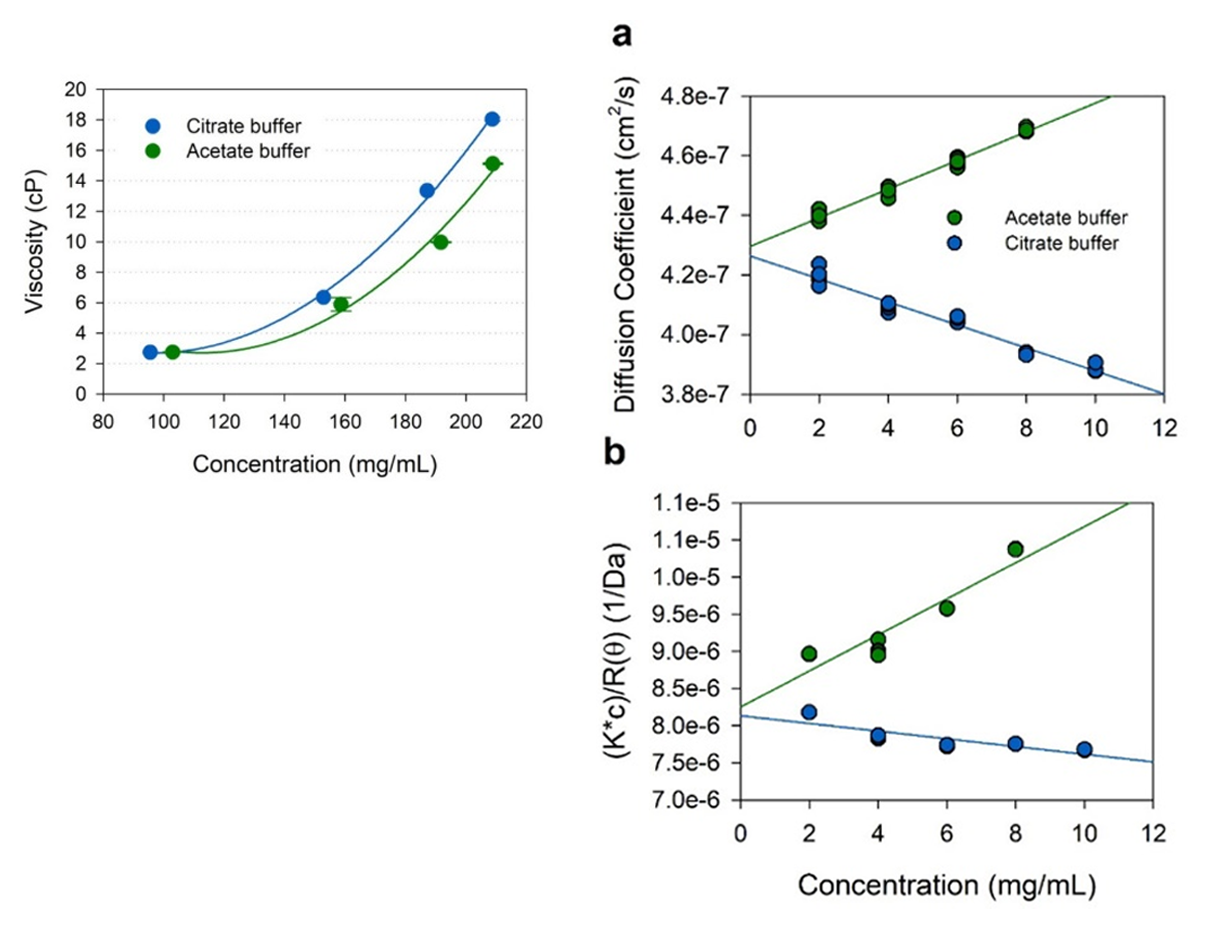
Viscosity profiles of IgG solutions from 95 mg/mL to over 209 mg/mL in acetate buffer (green) and citrate buffer (blue) at the same pH 4.6. Values are the mean and standard deviation from triplicate measurements.
Protein–protein interactions in acetate buffer (green) and citrate buffer (blue) at pH 4.6. (a) The diffusion interaction parameter (kD) analysis by DLS; (b) the second virial coefficient (A2) measured by SLS. Values were obtained from quintuplicate measurements.
Buffer Optimization
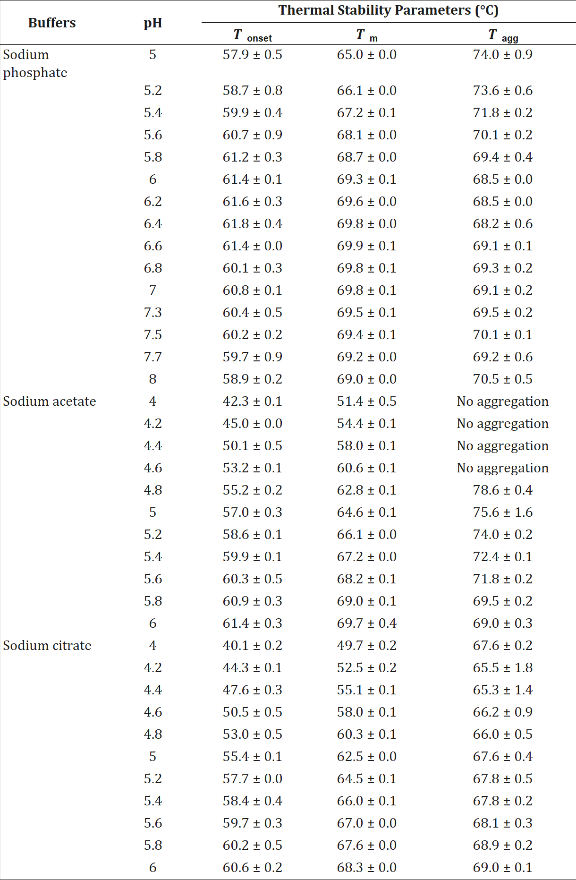
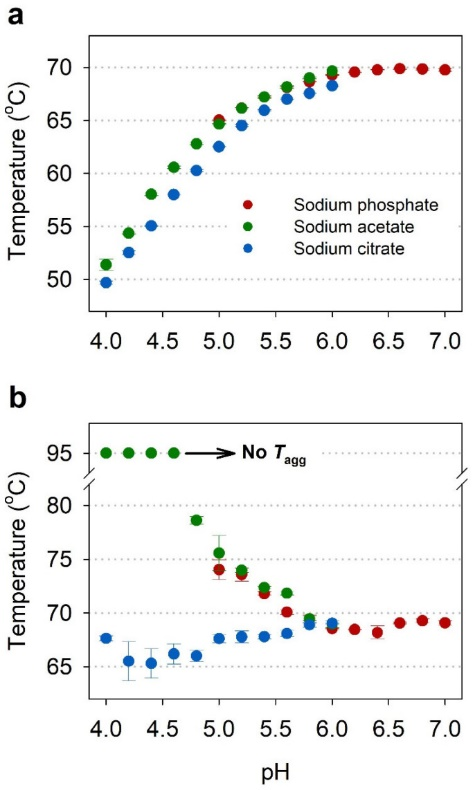
The thermal stability of IgG was investigated in three different buffers (sodium acetate, sodium citrate, and sodium phosphate), ranging from pH 4 to 8, in order to select the optimal pH (Table 1). The concentration of each sample was set to 1 mg/mL.
Effect of pH and buffer species on Tm (a) and Tagg (b) of IgG in three different buffers (red—sodium phosphate; green—sodium acetate; blue—sodium citrate), as measured by nanoDSF. (a) Graph of Tm of IgG as a function of pH; (b) Graph of Tagg of IgG as a function of pH. All samples were set at a concentration of 1 mg/mL and values are the mean and standard deviation of triplicate measurements.
Structural Biology
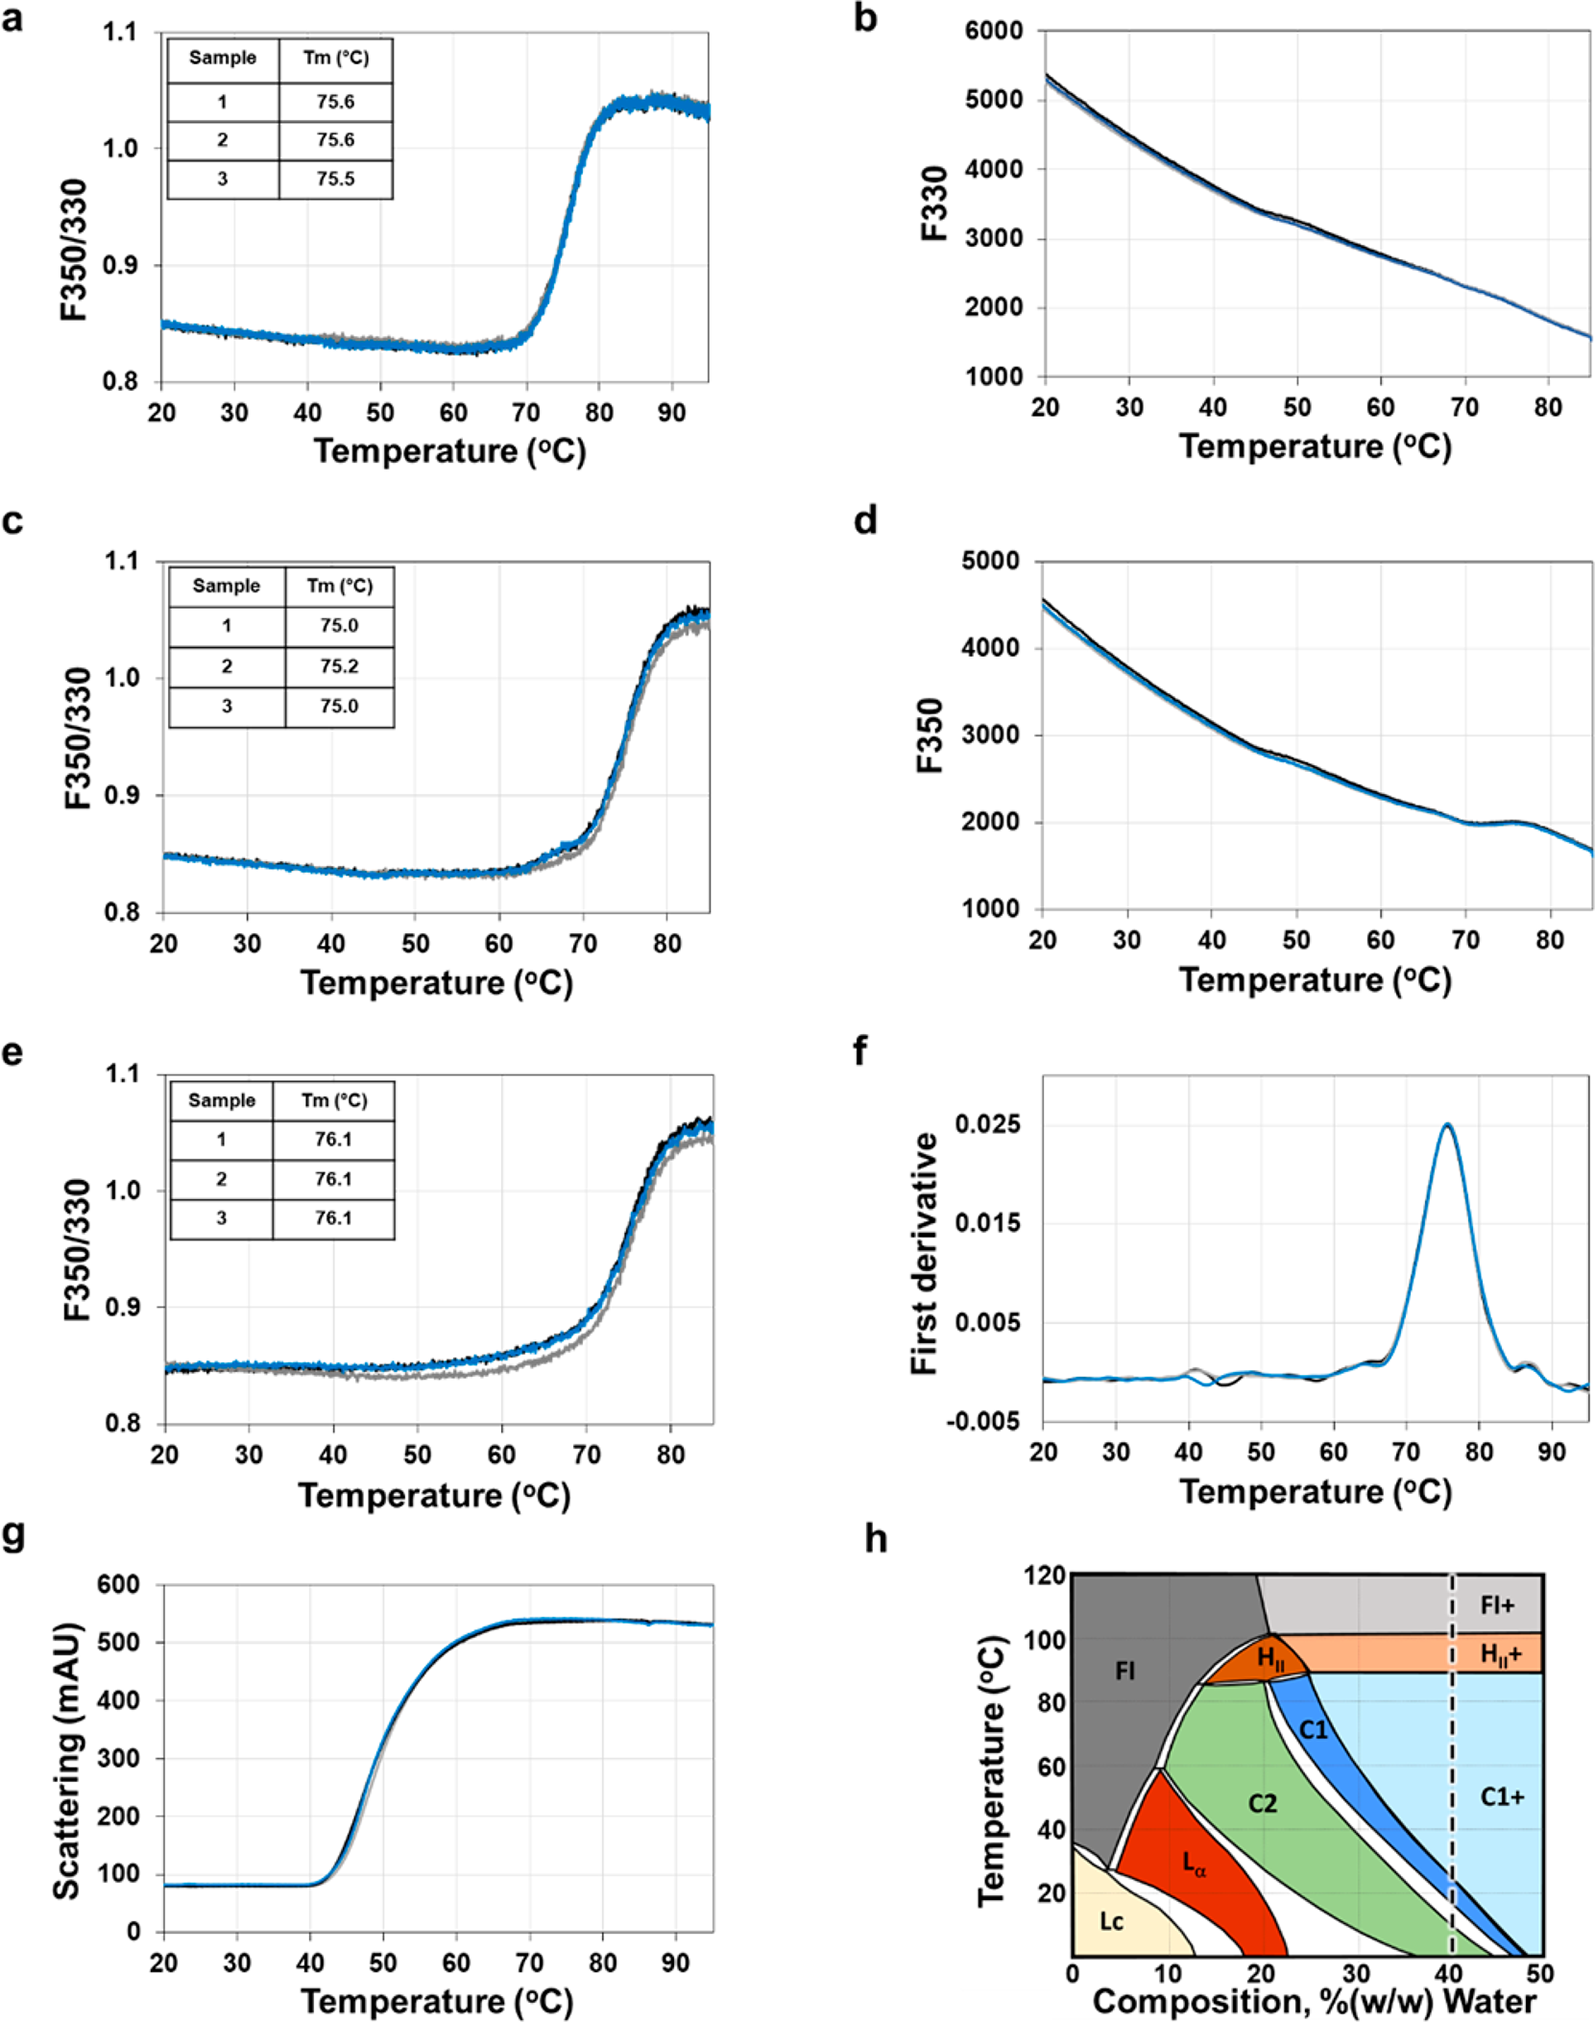
DSF and light scattering heating and cooling thermograms recorded with lysozyme in the LCP prepared with 9.9 MAG. a, DSF fluorescence ratio (F350/F330). b, F330 trace. c, DSF fluorescence ratio (F350/F330) of the heating thermogram to 85 °C followed by a cooling ramp (e). d, F350 trace. e, DSF fluorescence ratio (F350/F330) of the cooling thermogram to 20 °C. f, Derivative plot of the data in (a) identifies the inflection point in the curve as a peak at 75.6 °C. g, Light scattering profile. Thermograms were recorded using triplicate samples (blue, black, gray traces). h, A simplified version of the 9.9 MAG/water phase diagram with the 40 %(w/w) hydration isopleth identified as a dashed line.
Interested in a Specific Application?
Our team can help you determine how Propred fits your research workflow. Get in touch for a tailored consultation.
Contact Us